NSE, BSE & US · breakout swing trading
Know which of your setups actually pay.
A trading journal for Indian swing traders who work in R — profit or loss against what you risked — so a ₹8,000 win on a tight stop and a ₹40,000 win on a wide one finally compare.
Built for the way breakout traders actually work: VCPs, flat bases and cup-and-handles, entries off stage-2 advances, relative strength, and a stop you set before you enter. Log those and the journal will tell you which of them earns.
No card, and free while it is being built. If it ever costs something, nothing you have already logged gets locked up — it stays yours to read, export or delete.
- VCP
- Cup & handle
- Flat base
- High tight flag
- Double bottom
- Ascending base
- Weinstein stage
- RS rank
- Distance from pivot
- Breakout volume
- Charges to the paisa
- MTF interest
- US book, in dollars
Charges worked out to the paisa
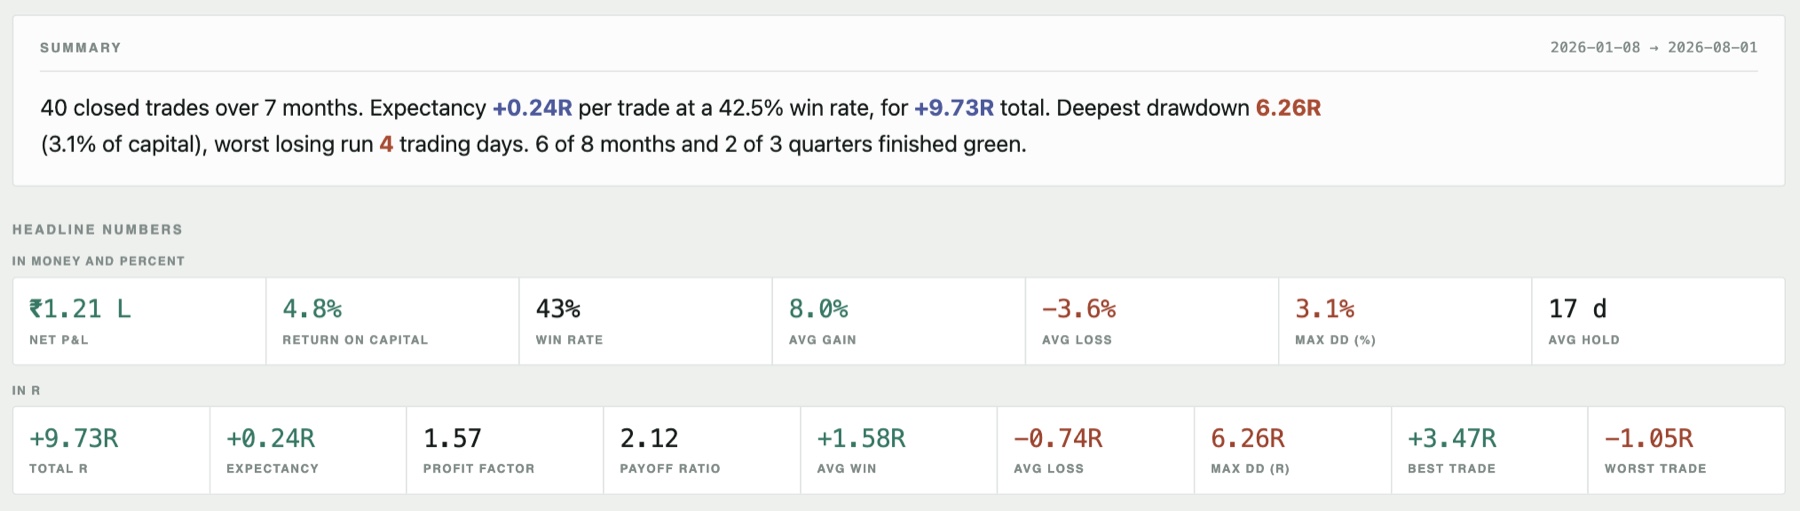
STT, exchange transaction charges, SEBI fees, stamp duty, GST and DP charges, computed the way your broker computes them — and taken from the file itself when you import a report that states them. Your real P&L is the one after costs, so that is the one the journal keeps.
Margin funding, costed properly
Trade on MTF and the interest is worked out per sell — the funded part, the calendar days you actually held it, and the pledge and unpledge fees beside it. Kept apart from brokerage, so you can see what carrying a slow trade on borrowed money really cost.
Bring the trades you have already made
Import a tax P&L or capital gains report from Zerodha, Groww or Dhan. The file says which broker it is, trades are matched by ISIN rather than by company name, and anything already in your journal is skipped. Every import can be undone.
A second book, in dollars
US trades are kept as their own journal — dollars, NYSE and Nasdaq tickers, SEC and FINRA fees, and a calendar year instead of April to March. Nothing is ever totalled across the two, because a rupee and a dollar do not add up. Import from Stockal or INDmoney. Ask and it can be switched on for your account.
It records what you actually look at
The base pattern — VCP, cup and handle, flat base, double bottom, high tight flag, ascending base. The Weinstein stage it was in. Its RS rank on the day you bought. How far the entry sat from the pivot, and what the breakout volume was against its thirty-day average.
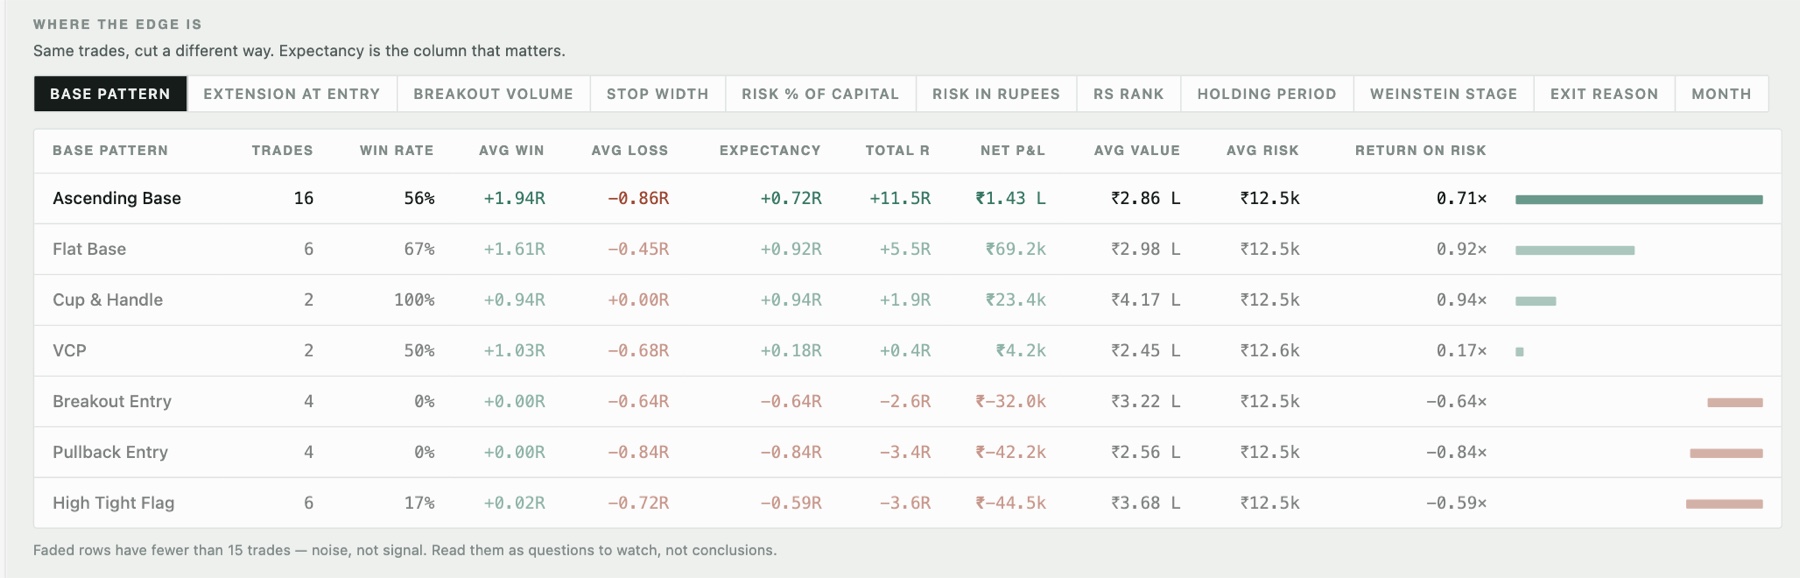
None of that is decoration. Every one of them becomes a cut of your own record: expectancy by pattern, by stage, by how far you chased the pivot, by how tight the stop was. That is the difference between a list of trades and knowing which setup to take tomorrow.
Alongside it: position sizing from your account size and risk percentage, an open-risk reading across every holding, and the R distribution once you have enough trades to mean anything. Your chart and your notes stay with the trade.
What it adds up to
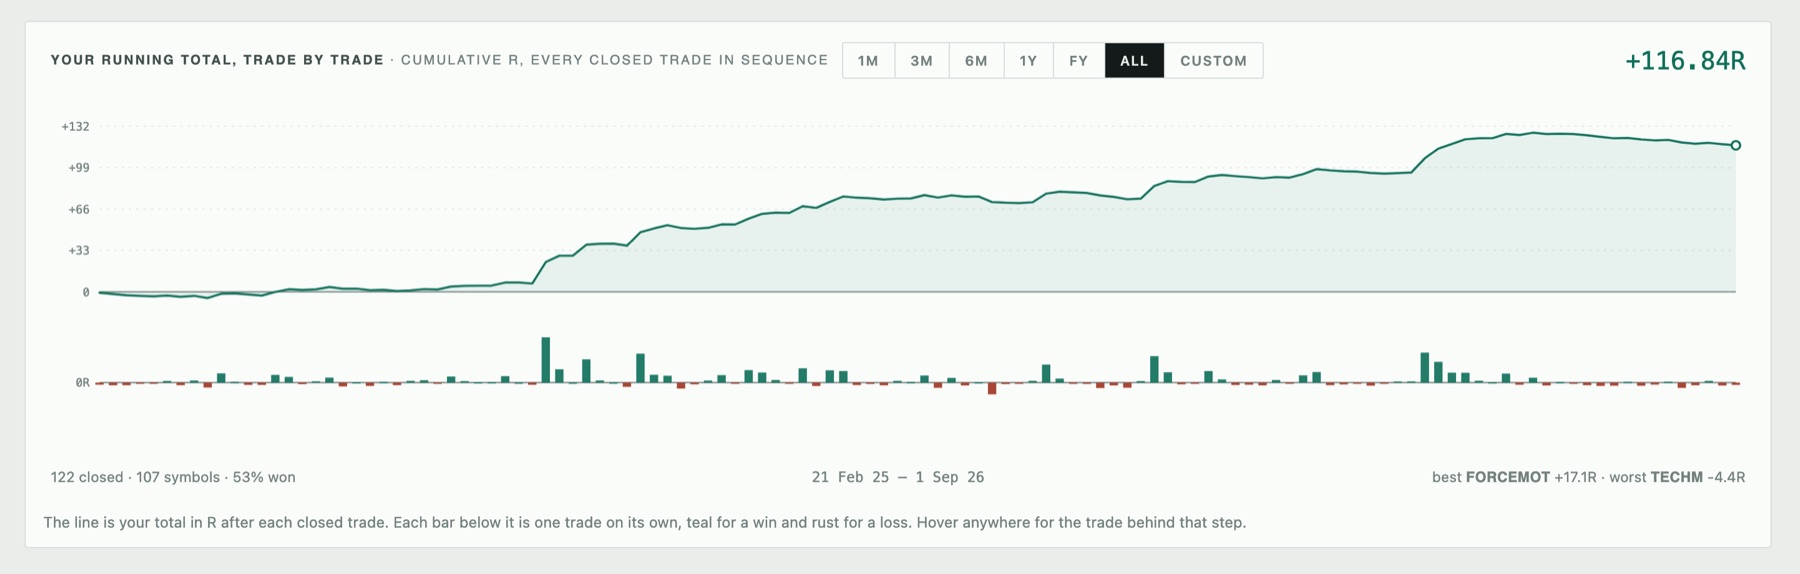
Every closed trade in sequence, in R — the line is the total after each one, and the bars beneath are the trades themselves, teal for a win and rust for a loss.
And where you are losing it
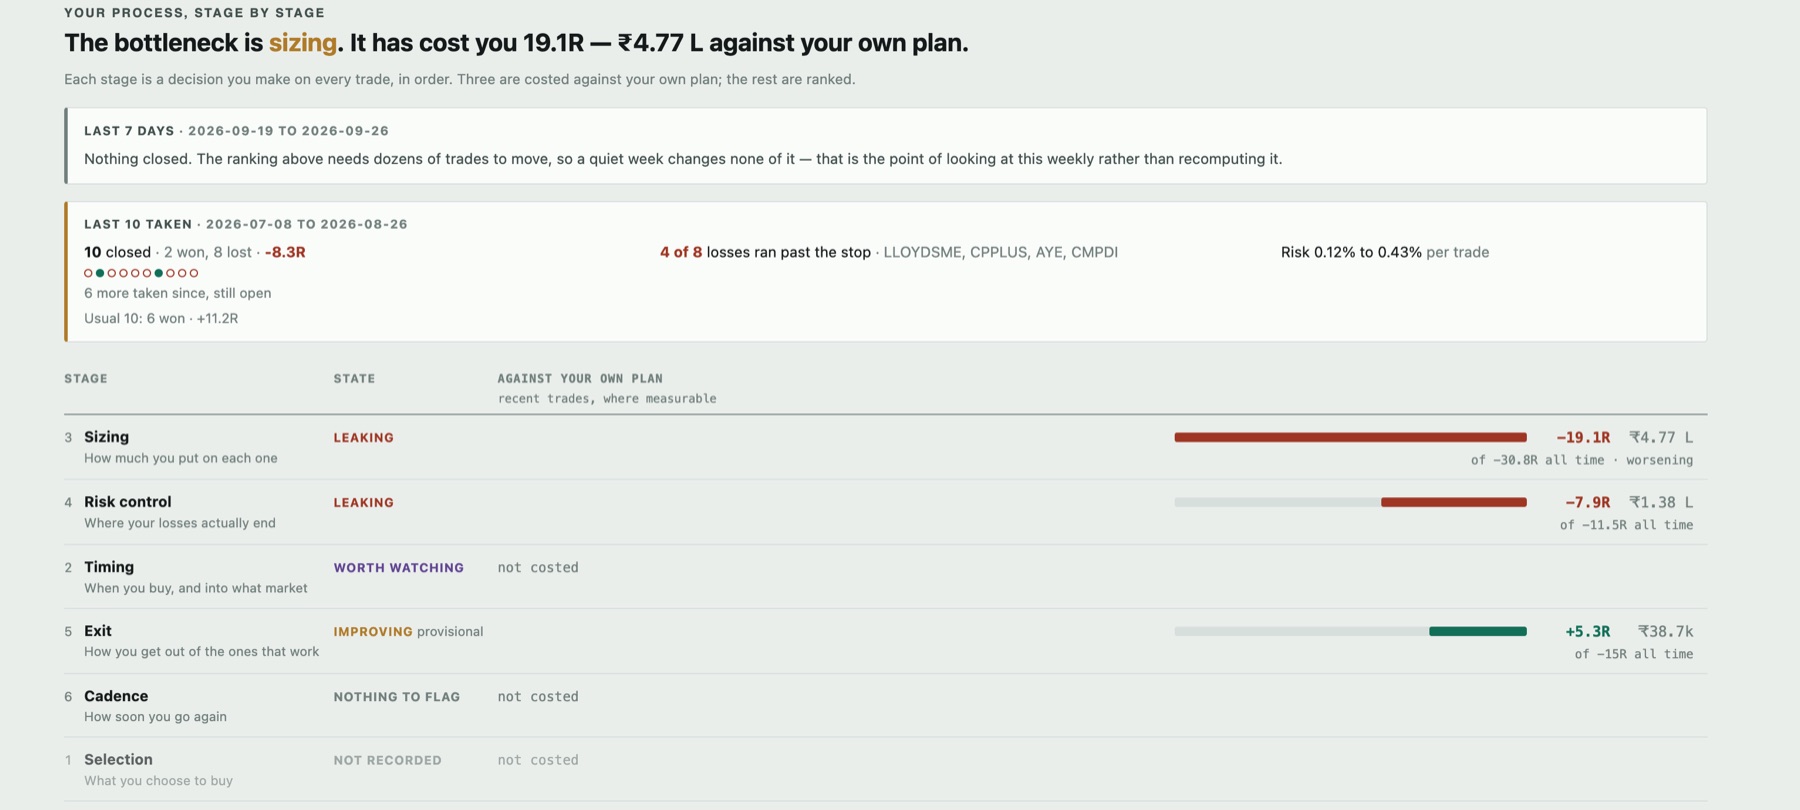
Every trade is a handful of decisions — what you bought, when, how much you put on it, where the loss ended, how you got out of the ones that worked. Three of them can be costed against the plan you set yourself. The journal does that and ranks the rest, so what comes back is one stage to fix rather than a page of statistics.
Questions
- What is an R multiple, and why measure trades in R?
- R is your profit or loss divided by the money you had at risk when you entered — the distance from your entry to your stop, times your position size. It makes trades comparable: a ₹8,000 win on a tight stop and a ₹40,000 win on a wide one might be the same 2R, or wildly different. Measured in rupees you cannot tell which of your setups actually pays.
- Does it calculate Indian brokerage and taxes?
- Yes — STT, exchange transaction charges (which differ between NSE and BSE), SEBI turnover fees, stamp duty on the buy leg, GST on brokerage and fees, and DP charges on the sell. Brokerage follows your own plan, whether that is zero-brokerage delivery, a flat fee per order or a percentage. Any figure can be overridden by typing it, and an overridden figure is never recalculated.
- Can I import my existing trades?
- Drop in the tax P&L or capital gains report from Zerodha, Groww or Dhan and it works out which broker it came from by reading the file. Trades are matched by ISIN rather than by name, re-importing an overlapping period skips what is already there, and any import can be undone.
- Who is this actually for?
- Swing traders who work from base patterns and a stop set before entry — VCPs, flat bases, cups, high tight flags — and who want to know which of those setups pays rather than only what the month made. It records the pattern, the Weinstein stage, the RS rank, the distance from the pivot and the breakout volume, then cuts your own expectancy by each of them. If you trade intraday, or hold for years without a stop, almost none of that will be useful to you.
- What does it cost?
- Nothing at the moment. It is free while it is being built and there is no card to enter. You can export everything you have logged as a single file at any time, and delete your account and its data whenever you like. If a paid tier does arrive, what you have already written stays readable and exportable — the parts that are sold are the ones that add new work, never the record you have already put in.